
Module in AI Marketing Manager
Reports that build themselves, from numbers you can trust
Define a KPI once and Manager collects it from the source that owns the number. Put the KPIs together in a dashboard for the meeting, share it with a link, and let a scheduled report land in the inbox of people who never log in.
Reporting is the module in CitationLab AI Marketing Manager that turns your data into KPIs, dashboards and reports. KPIs are collected automatically from sources such as Google Analytics 4, Search Console, Google Ads, Meta, AI Monitor and rank tracking, with targets and a direction. KPI dashboards (KPI Decks) can be shared through a link or exported, and scheduled reports are delivered by email.
01The problem
The monthly report eats a whole day
Monthly reporting is often a day of copying: numbers from GA4, Search Console and the ad accounts into a spreadsheet, then on into a slide deck. The next day, the next month begins.
And the numbers drift. Sources revise the last few days, people pick different periods, and last month's figure doesn't match what you said in the meeting. Nobody can tell whether a number is good without someone interpreting it.
Reporting in Manager collects the numbers itself, knows which direction is good for each KPI, and holds a closed period fixed once it has been reported. The time goes on what the numbers mean.
02How it works
How it works
- 01 / 04
Define the KPIs
Pick a source and a metric, say whether up or down is good, and choose a period and a target. Any conversion you have defined can also become a KPI.
- 02 / 04
Let them collect themselves
Values are refreshed from each source several times a day, and the baseline is captured automatically. Closed periods are held fixed, so a month you have reported doesn't change afterwards.
- 03 / 04
Build the dashboard
Combine KPI, chart, table, target and funnel blocks with written notes in a KPI dashboard. Templates give every project or client the same structure.
- 04 / 04
Share and schedule
Share a dashboard through a link that needs no account, export it to CSV or Excel, or set up a scheduled report that arrives by email every week or every month.
03Inside
What you get
KPIs from the sources you already use
GA4, Search Console, Google Ads, Meta Ads, TikTok Ads, OpenAI Ads, rank tracking, AI Monitor, Ahrefs, Cite Analytics, backlinks, PageSpeed and your own conversions, or manual entry. A KPI can be filtered, for example to one page or one keyword.
Targets that mean something
Each KPI knows whether up or down is good, so improvement and decline show without interpretation. Link KPIs to goals in Strategy Hub, and progress updates itself.
From a falling number to a task
Open a KPI from Search Console or Google Ads and see the queries, pages, keywords and ads that moved it. Right-click a row to create an action with the numbers already filled in.
Dashboards for the meeting
KPI dashboards built from blocks: single KPIs with a sparkline, charts, tables, target progress, funnels, cohort curves and notes. Shareable through a link you can revoke at any time.
Reports that send themselves
A monthly client report with KPIs, traffic, conversions, rankings, Search Console, Google Ads, AI visibility, backlinks and competitors, and an activity report with the completed work as a PDF. You choose the sections and the schedule.
Warned before it's too late
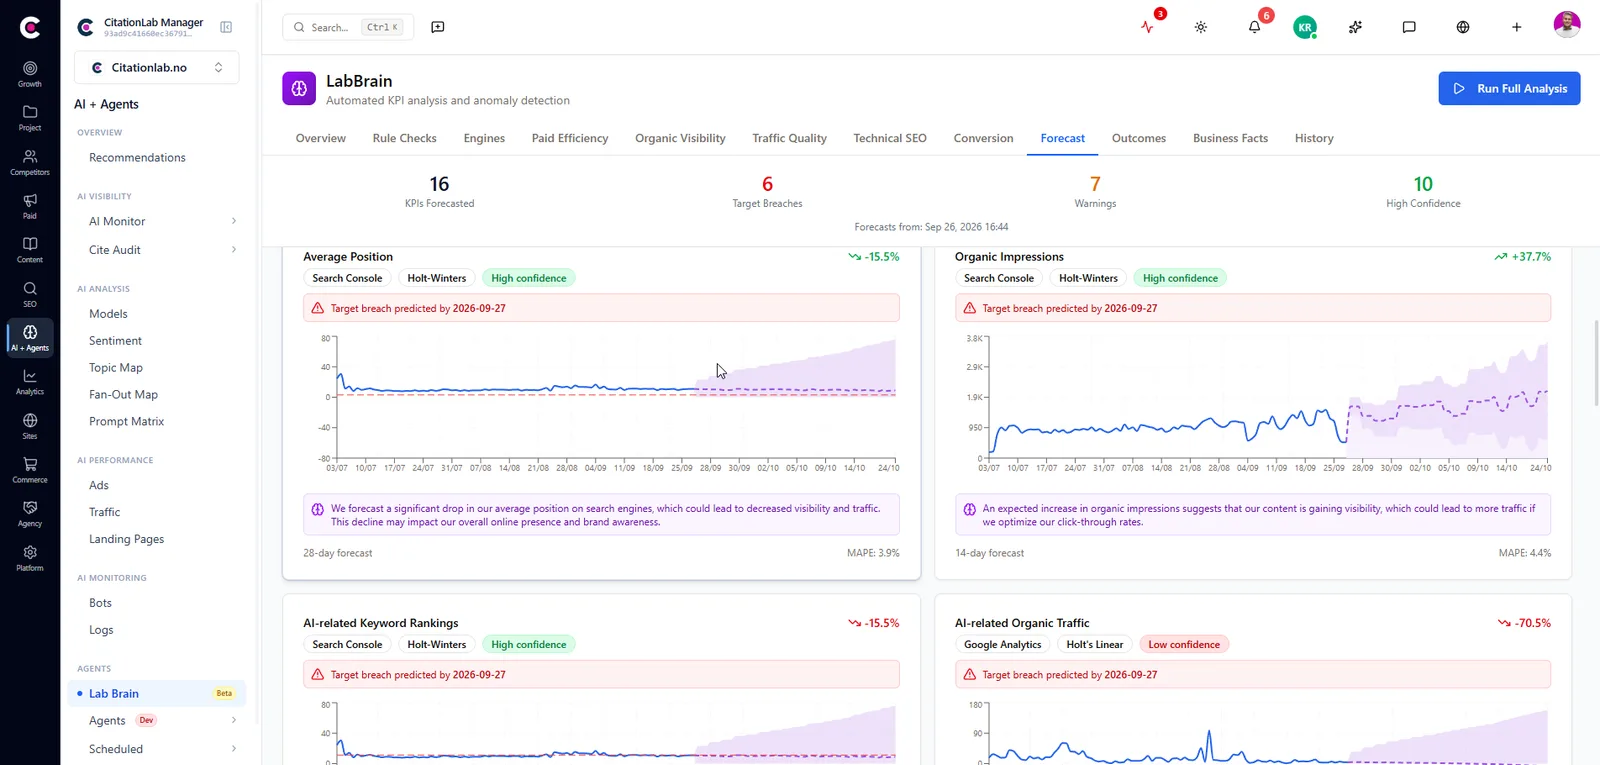
Set an alert for when a KPI crosses a line you choose. Lab Brain forecasts where each KPI is heading and tells you when a target looks set to be missed.
From Manager
04The outcome
What it changes day to day
- The monthly report takes minutes instead of a day
- Everyone looks at the same number for the same period
- Clients and leadership get the results without needing a login
- A KPI heading the wrong way becomes an action, not a slide
- Reports show the work done next to the numbers it was meant to move
05FAQ
Questions about reporting
- What data can a KPI use?
- Google Analytics 4, Search Console, Google Ads, Meta Ads, TikTok Ads, OpenAI Ads, rank tracking, AI Monitor, Ahrefs, Cite Analytics, backlinks, PageSpeed and any conversion you have defined in the project. Numbers that live in no connected source can be entered by hand or through the API.
- Why does a KPI differ from the number in the source tool?
- Check the period first: calendar and rolling periods rarely agree. Sources also revise the last few days. Once a period is closed, Manager holds the number fixed, so a figure you have reported doesn't drift.
- Can people without an account see the reports?
- Yes. A KPI dashboard can be shared through a link that needs no login, and scheduled reports are delivered by email. Anyone with the link can read it, so share it deliberately. You can revoke it at any time, and the old link stops working immediately.
- Can I get history from before I created the KPI?
- For sources with history, such as GA4 and Search Console, the first sync brings the history with it. Meta Ads and TikTok Ads start from the last 90 days. For data Manager measures itself, collection starts when the KPI is created.
- How does reporting relate to Lab Brain?
- Lab Brain reads the same KPIs. It forecasts where each one is heading, warns before a target is missed, and proposes actions. Reporting shows the numbers; Lab Brain helps you decide what to do about them.
06More modules
It connects to everything else
- Lab BrainReads across modules, forecasts where your KPIs are heading and gives prioritised recommendations that learn from what actually worked.
- AnalyticsCite Analytics, GA4 and Search Console in one place, with traffic from AI assistants, heatmaps, funnels and a measurement plan.
- ActionsEvery finding, recommendation and change becomes a tracked action with an owner, a priority, a readable key and a measured result.
- Post-analysisAutomatically measures whether a change to a page actually moved clicks, traffic and conversions, after 7, 14 and 28 days.
Try reporting on your own site
Create an account and set up your first project in a few minutes.
Was this page helpful?